
This is a brief tutorial on how to read our premium calls.
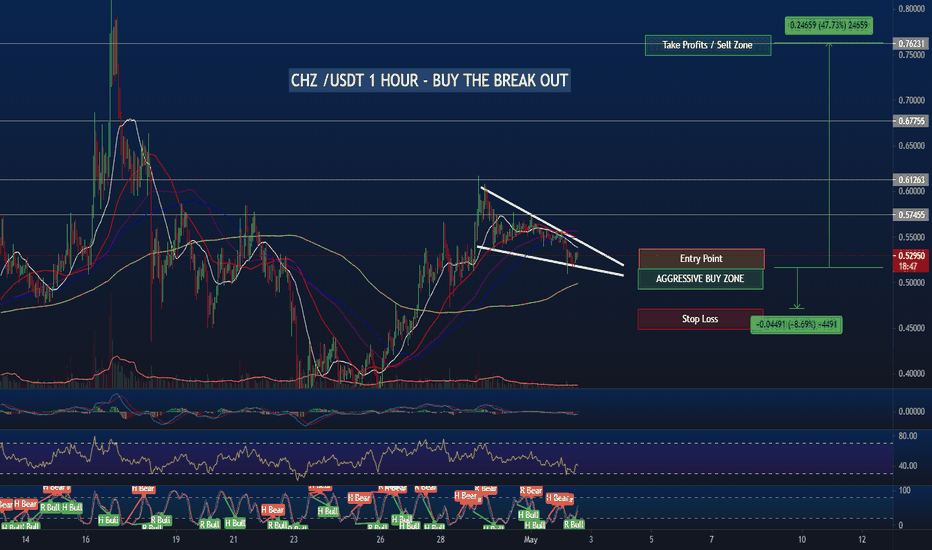
On the chart above you will see grey lines these represent the areas we advise to take some profits. Why do we have various point to exit
you may ask? Well lets just imagine that we had one goal of $0.76 for CHZ and it reaches all the way to $0.74 and crashes back down to
the stop loss, you made zero on the trade.
Now on the other hand if that same plays out you will have laddered in profits at each grey line to the tune of 25% of the investment.
Meaning you will have still made profits even if it crashes out. This is why we post these setups.
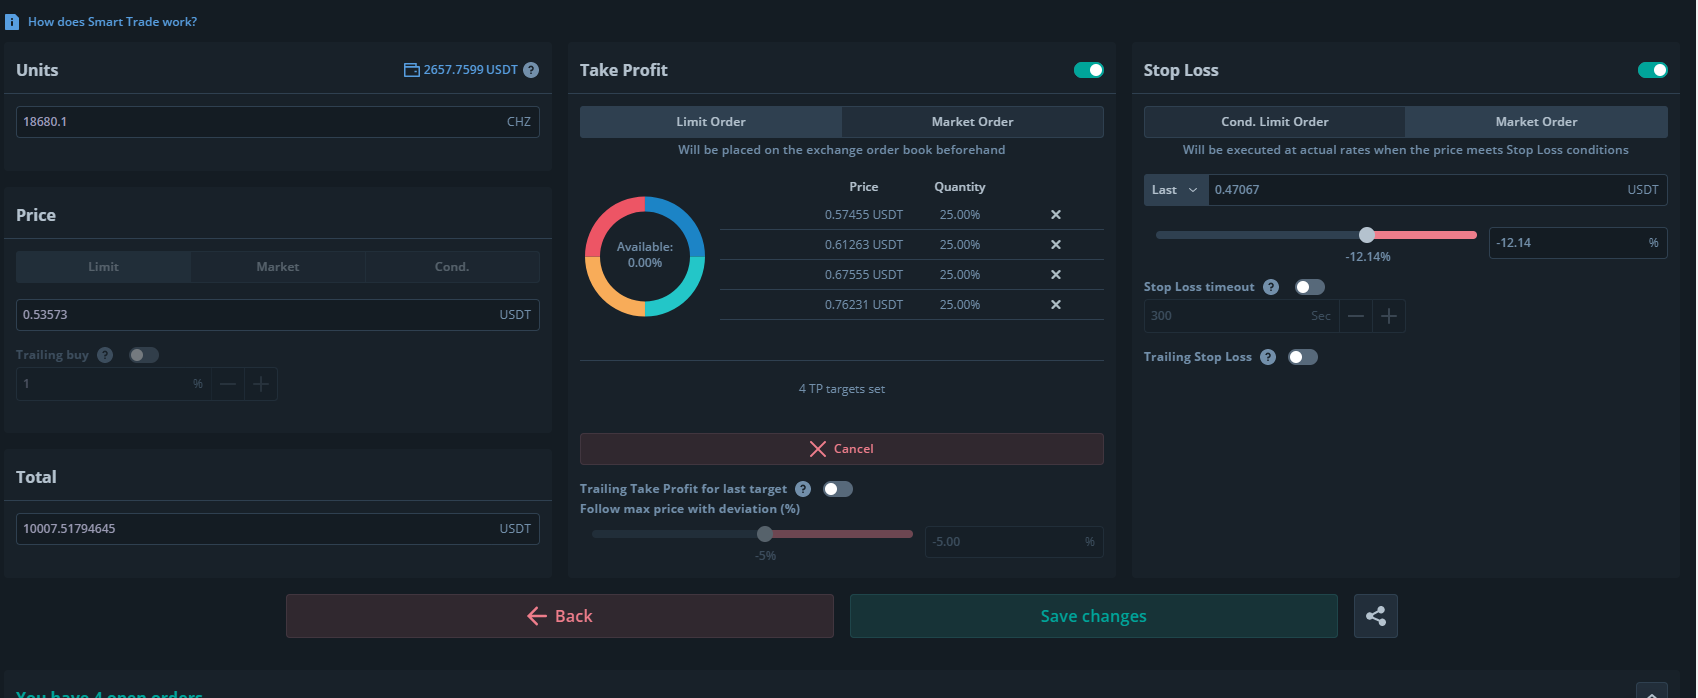
Now on the above you will see we have added 4 x 25% exits to the call to match the chart 1.) at $0.57455 2.) another at 0.61263 3.) another at 0.67555 4.) and finally another at $0.76231 these all correspond to the grey lines on the chart. We have also added a stop loss that matches the chart at $0.47067 meaning the call will end and crash out if the market suddenly decided to tank.
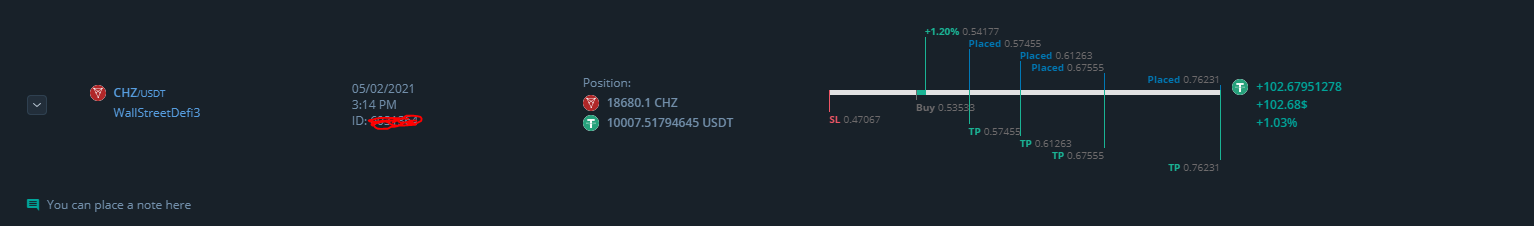
The final image shows that you have done everything correctly and can now walk away and leave the trade to play out if need be, setup some alarms also in case.
We recommend you use 3Commas to trade our calls it simplifies the way you trade and you can always see exactly whether you are in profit or loss on a trade at a glance.
Get 3commas here
You can join our premium by clicking the link here